
#RealityCheck - Some People Are Afraid To Mention The Complete Truth

People don’t tell you THIS THING about support and resistance. So I will.
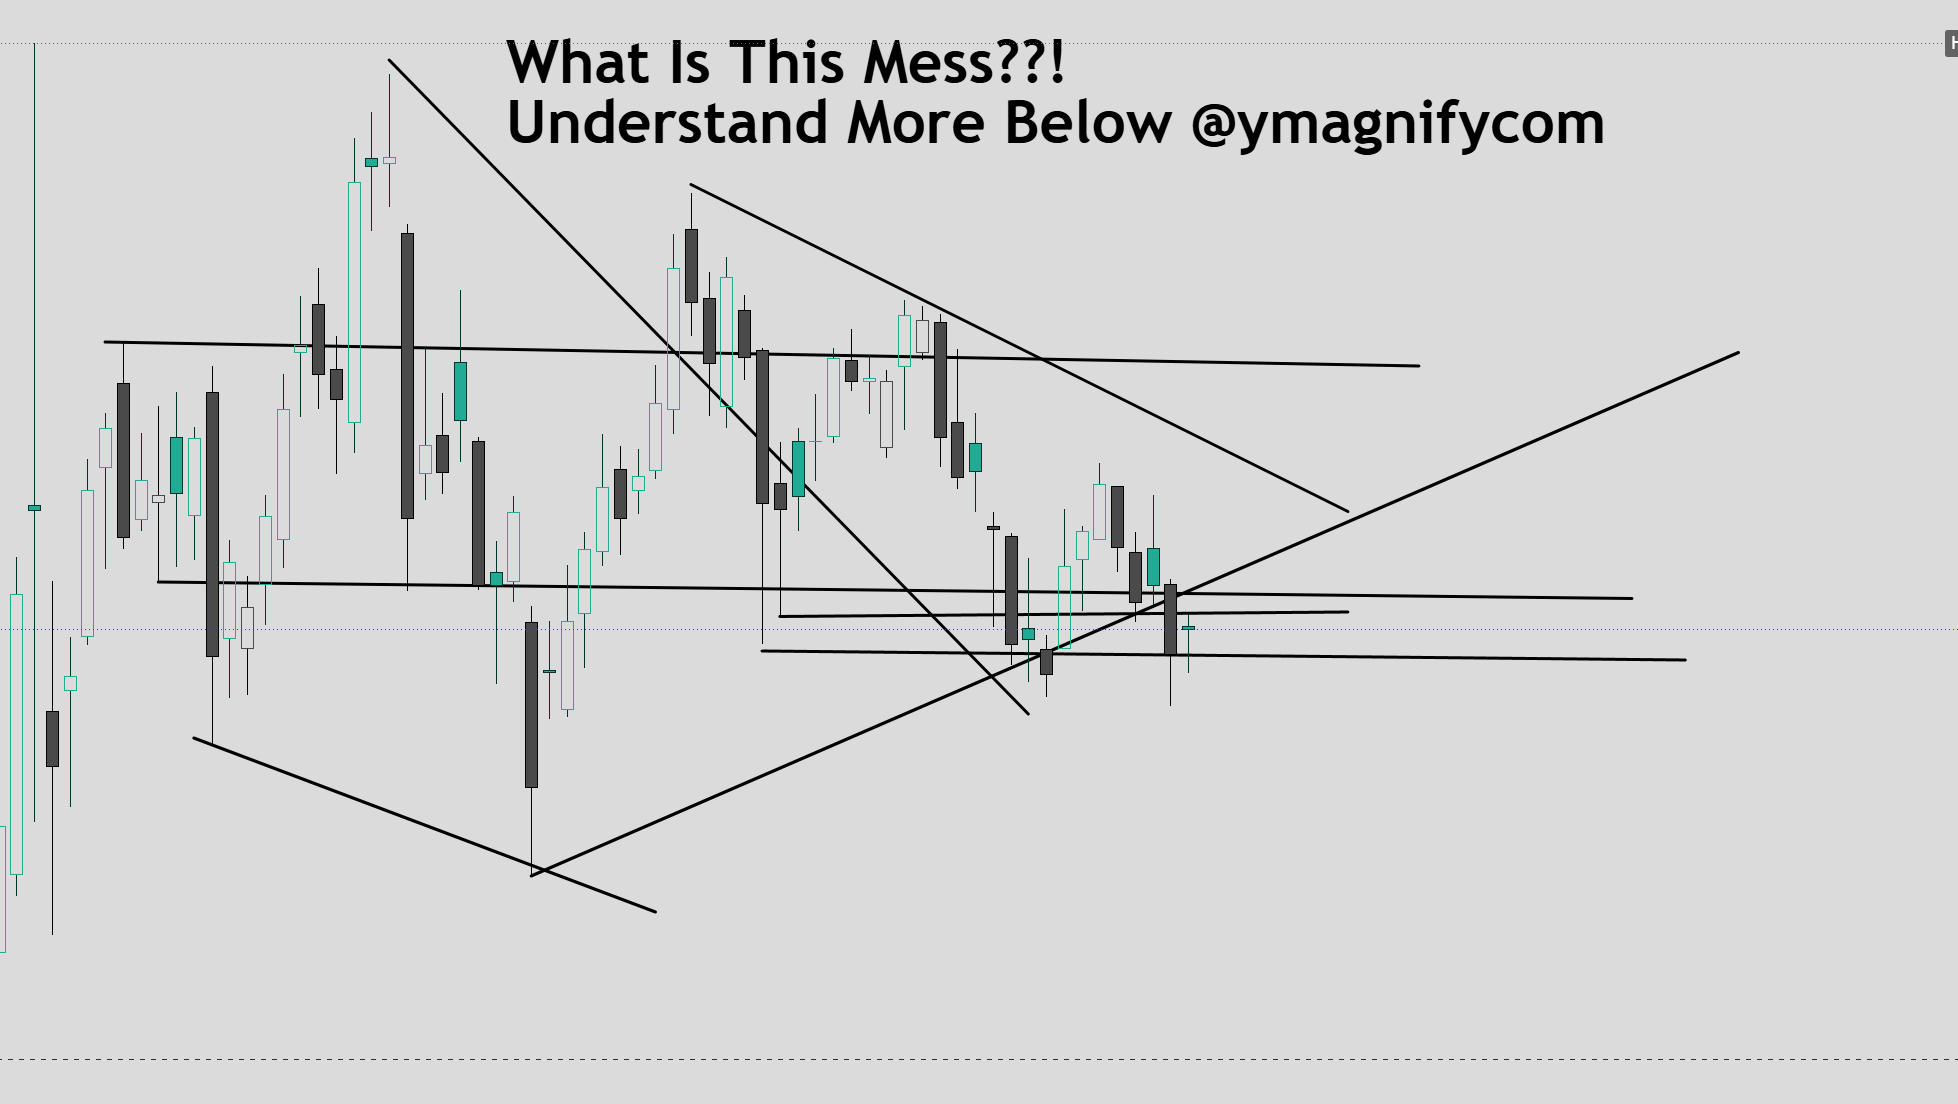
Most traders draw horizontal lines on their charts and call them support.
Then they get frustrated when price blows straight through them like those lines never existed.
Here is the truth.
Support and resistance are not lines.
They are zones.
And they are not static.
They shift based on volume, time, and the decisions of the market participants who actually matter.
When $ES $ES_F tests a previous high, it is not just a price level being retested. It is the same group of traders who bought at that high now facing a real decision.
Do they hold? Do they add? Do they cut?
The chart is a record of human decisions.
Every level that matters is a moment where a large group of people made the same choice at the same price.
When you understand that, you stop treating technical levels like magic lines and start treating them like psychology maps.
Three things that actually make a support or resistance level valid.
First, it needs volume behind it.
A level touched on thin volume means almost nothing. A level where price turned on massive institutional volume means everything.
Look at the volume bars under the candles. They tell you who was actually there.
Second, it needs time.
A level that held for three weeks is significantly more meaningful than one that held for three hours.
Time gives participants the chance to build real positions at that price, which means more capital is tied to that level breaking or holding.
Third, watch for the flip.
When support breaks, it becomes resistance. When resistance breaks, it becomes support.
This role reversal is one of the most reliable setups in all of technical analysis and most retail traders completely ignore it.
Next time you are drawing your levels, ask yourself this:
What decision did traders make here, and what happens to all of them if this level breaks?
That question alone changes how you read every chart you will ever look at.
Save and share this post. Come back to it when needed. If anything, you can send me a DM as well. I am going deeper on volume profile next week.
One single “tool” or “strategy” will never be ‘enough’ or perfect. Time is changing. Market is changing. Adapt or get left behind. Find what works best for you.
#TechnicalAnalysis #YMagnify #TradingPsychology #TradingCommunity #TradingLife
If you read until here, it means you want quality over ‘online noise’. If this motivates you or if this is a harsh important truth that brings you discomfort, but determination, then you are in the right place. You are growing with us.
See you soon. Stay focused. Subscribe to this publication.
Stay prepared. We grow together,
Yuna, Senior Analyst
Manager YMagnify.com
*Disclaimer: This content is for educational and informational purposes only. It is not financial, investment, tax, or legal advice. Markets involve risk, and you are solely responsible for your decisions. Results always vary, depending on the individual. Always do your own research and decisions before acting.
The point about charts being records of collective decisions rather than collections of price levels really stood out to me. Support and resistance tend to become much more meaningful when viewed through the behavior of market participants rather than as fixed lines. Volume, time, and the reaction around a level often tell a deeper story than the level itself.