
Bitcoin-Panic: What Really Happened on December 17 and how to take advantage of it
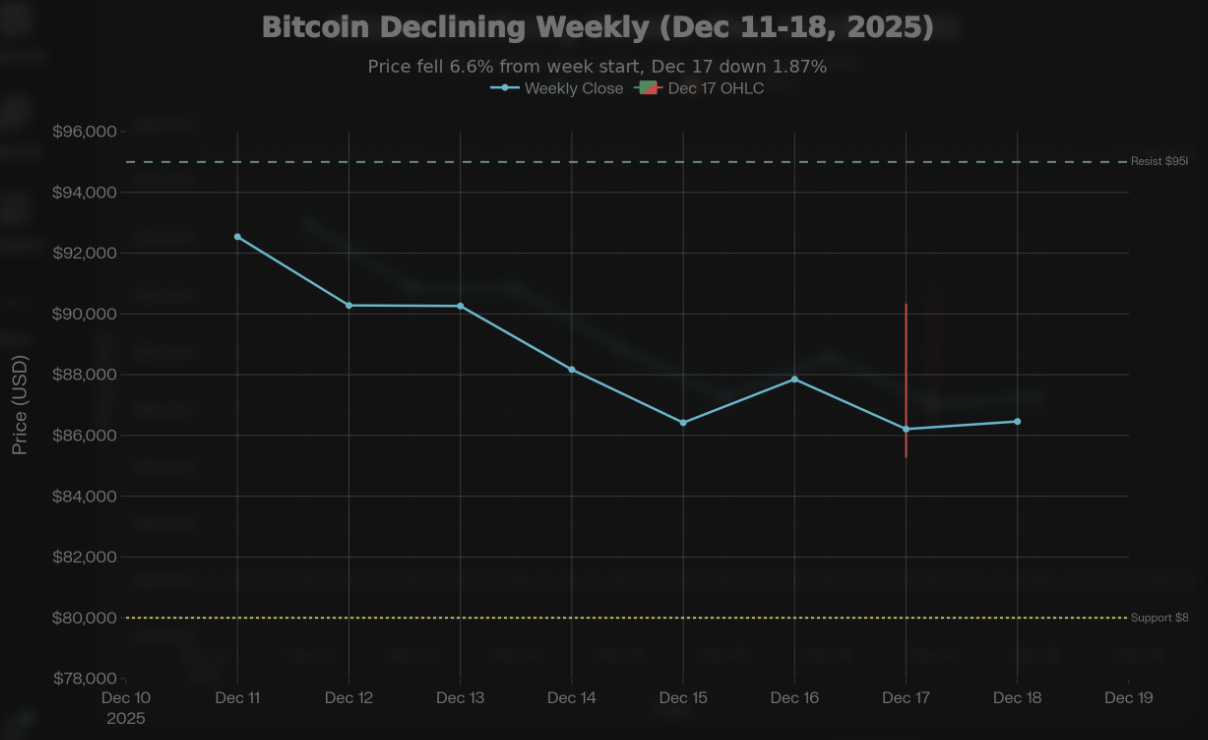
This wasn't just another red day—it's part of a broader week-long pullback that saw Bitcoin shed over $6,000 from its December 11 peak of $92,540. Here's what you need to understand about why this hap

Welcome to Save Time with YMagnify.com. As the name says, this is meant to skip long introductions, confusing headlines and save everyone more time to focus on the markets and to manage our portfolios properly. It’s made by a real certified economist and market analyst for busy people everywhere. Let’s dive in.
What happened

On December 17, Bitcoin showed classic rejection patterns that tell us something important about market psychology. The price bounced from its support zone near $85,000 and pushed toward $90,000, only to get rejected at resistance. This is textbook distribution, buyers stepped in briefly, then sellers took control.
The technical picture is straightforward: Bitcoin bounced from multi-month lows around $85,000 that it had tested earlier in the week, but it failed to hold above $88,000. That failure matters because it shows the bears still have control. According to technical analysis from major trading desks, as long as Bitcoin stays below the 50-day moving average currently sitting at $95,000, the path of least resistance remains downward.
Why it’s happening - in simple words
Here’s the thing people aren’t talking about enough: on December 16-17, there was a regulatory curveball. The US Senate Banking Committee delayed the hearing on crypto market structure legislation until early 2026. This wasn’t small news. This bill was supposed to clarify the roles between the SEC and CFTC, creating legal certainty for the entire market. When that got delayed, the crypto market reacted with about a 3.6% decline across the board, and Bitcoin dropped nearly $5,000.
This is important because it shows you something real about Bitcoin’s current state: it’s more sensitive to regulatory uncertainty now than it’s been before. That’s maturation, but it’s also a vulnerability.
Why the Numbers Look Messy
The global crypto market cap is now $2.94 trillion to $3.03 trillion depending on which data source you check.
That’s actually stable compared to the real story, Bitcoin is struggling to hold levels that should feel natural for it. The market isn’t crashing, but it’s consolidating with heavy uncertainty.
Bears keep a technical edge because momentum is fading.
Let me be clear about something: this isn’t a crash. A crash would be breaking below $80,000. A crash would confirm that Bitcoin’s entire 2025 thesis was wrong. Yesterday wasn’t that. Yesterday was a technical rejection after buyers failed to push through resistance. That’s normal market behavior, but it’s important behavior.
The Speculation Cycle: Pump, Dump, and Regulation
There’s been chatter about pumps and dumps, and frankly, some of it is legitimate concern. Here’s how to think about it:
Bitcoin went from around $65,000 in April 2025 to nearly $126,000 in early October. That was the pump, driven by Trump administration pro-crypto sentiment, federal reserve rate cut expectations, and institutional capital flowing in through new ETFs. Then came the dump, Bitcoin is now down 32% from that October peak.
The question everyone asks: was that a pump-and-dump scheme? No, but yes, and here’s why.
Large institutional holders (whales) definitely took profits at the top.
That’s not manipulation, that’s normal market behavior.
What’s concerning is the regulatory uncertainty and lack of clarity about where crypto fits in the financial system.
When that uncertainty exists, retail traders get scared, sell at lower prices, and then institutions buy back cheaper. That’s not conspiracy, that’s just how markets work when information is asymmetrical.
What’s Uncertain Going Forward
The immediate technical picture gives us three scenarios:
Scenario 1 (Most Likely): Bitcoin grinds sideways between $80,000 and $95,000 for the next 1-2 weeks while the market figures out what regulatory clarity means. This is boring, frustrating, and usually where smart money accumulates before the next move.
Scenario 2 (Bullish): Bitcoin breaks above the 50-day EMA at $95,000 with volume, then pushes toward $100,000 and potentially $108,000. This requires a positive catalyst, either regulatory news, macro data supporting rate cuts, or strong institutional buying pressure.
Scenario 3 (Bearish): Bitcoin breaks below $80,000 support zone. If that happens, the next target is $72,000-$78,000. This would invalidate the bullish year we started with and confirm that Bitcoin’s 2025 peak was the real cycle top
What to Do Right Now
The smart move right now isn’t to predict the next big move. It’s to respect the consolidation range, manage your risk with tight stops, and wait for price to tell you which direction has stronger conviction.
One more thing: the fact that Bitcoin is struggling during what’s historically the strongest season of the year (Q4 is usually Bitcoin’s best quarter) is unusual.
That suggests headwinds are real, not just sentiment, but actual structural challenges in institutional appetite. That’s worth watching closely.
Want this translated into weekly levels, setups, and hedge templates in under five minutes?
Subscribe to YMagnify on Substack.
For live reads and intraday charts, follow @ymagnifycom on X (Profile here) and follow the AUDIO news on SPOTIFY (Rushing Simplified News for Busy Investors) and the visuals on YOUTUBE (YMagnify’s official YouTube).
Stay awesome. We grow together,
Yuna, YMagnify.com
Regulator uncertainty is a killler, but the direction toward greater clarity is clear, BTC maybe volatile but that also factors in to its big upside